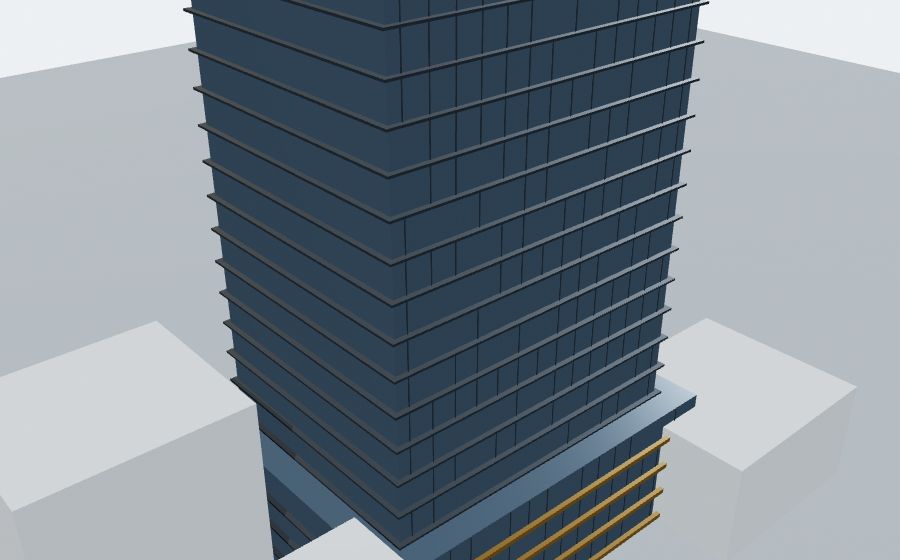
Harbor Tower
OfficeBoston, Massachusetts
- Stabilised NOI
- $18.4M
- Occupancy
- 94.2%
- Cap rate
- 5.10%
- Hold
- 7 yrs
Commercial real estate, institutionally
Keystone Asset Management acquires and operates office, retail and multifamily assets in gateway markets. Every asset is modelled before it is bid.
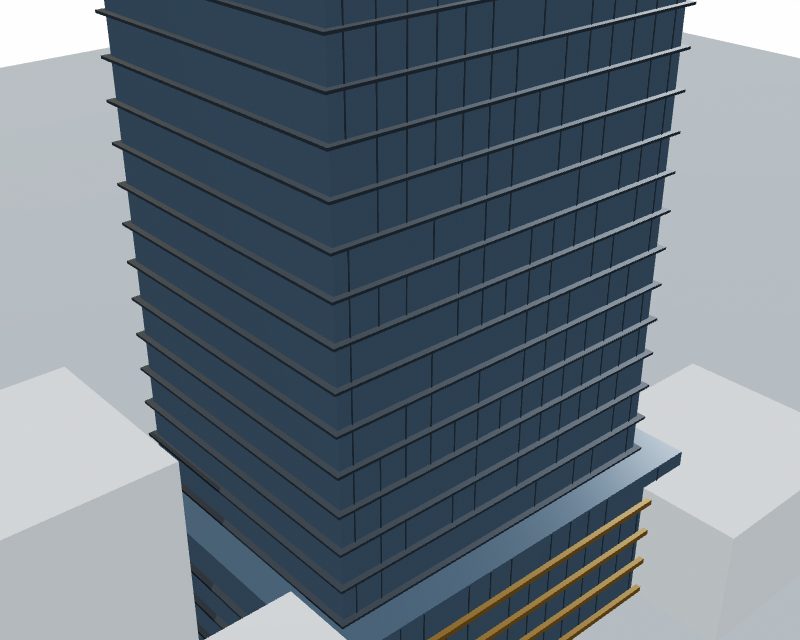
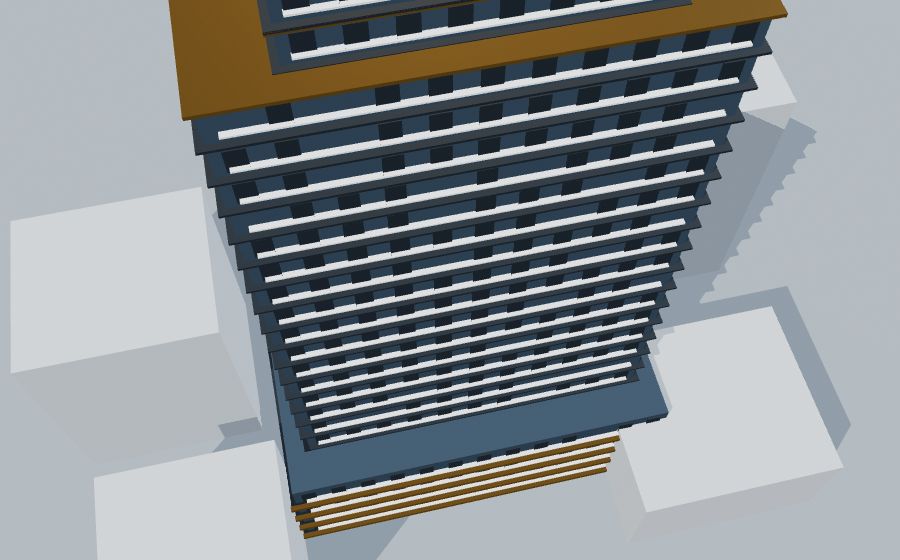
Level selector. Podium, tower and crown plates are modelled to underwriting standards.
Massing, floor plate efficiency, glazing ratio and vertical transportation are resolved in the model before capital is committed. Select a level on the model above.
Why this matters
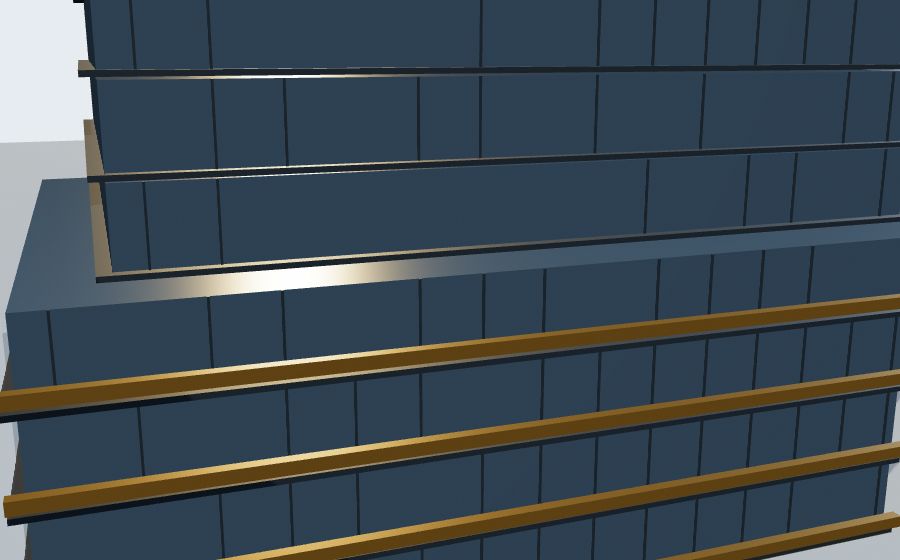
The podium carries retail frontage at street level. Podium floors trade at a lower rate per square foot than tower floors, but they anchor the tenant mix and drive footfall to the upper levels.
Four positions in the current fund. Three office, one multifamily. All held through the cycle.
Boston, Massachusetts
Chicago, Illinois
Austin, Texas

Denver, Colorado
Strategy
We buy in metros with 2M or more residents, positive net migration and a diversified employment base. Submarkets we cannot map on foot are submarkets we do not underwrite.
Every acquisition must clear a replacement cost test. If a competitor can build it cheaper than we can buy it, we pass. That discipline removed 41 of 47 prospects last cycle.
We target assets where NOI is recoverable through leasing and capital improvement, not rent speculation. Value-add is planned in the model before the LOI is signed.
Audited net returns to limited partners. No pro forma, no projections.
Net IRR by vintage year. 2019 and 2022 reflect the two positions held through distress.
Market-level filters against migration, employment and replacement cost. Roughly 47 prospects screened per acquisition.
Full massing and floor plate resolution. Rent roll, lease expiry and capital stack are stress-tested against three scenarios.
Investment committee review. The model, not the narrative, carries the decision. Anything that cannot be modelled is not bought.
Capital deployment, then asset management takes over. Reporting goes to limited partners monthly, not quarterly.
The current fund is open to accredited investors. Membership is limited to 40 entities per vintage year. Quarterly allocations close on the last business day of the quarter.
White-label this institutional CRE landing page for your firm